How I write an R function
One of the things that I was fortunate to learn relatively early in my R career was how to write a function. Functions allow you to avoid duplicating code, and facilitate better readability, maintenance, and testing of your code.
Over the years, how I write functions has changed. Due to an out-sized influence of one DTL, I now write my functions in a somewhat atypical style, which I thought might be worth showing.
The problem
We have three CSV files which contain data we would like to bring into a data.frame. Each file is the output of a hydrodynamic model, and is arranged with each row representing a time, and then each column representing a different treatment, in this case distance from the center point.
Here is what the hydro data looks like:
                  Time NEG600 NEG400 NEG200 NEG100 NEG50 NEG1 LC POS1 POS50
1 22-Oct-2019 18:01:00      0      0      0      0     0    0  0    0     0
2 22-Oct-2019 18:02:00      0      0      0      0     0    0  0    0     0
3 22-Oct-2019 18:03:00      0      0      0      0     0    0  0    0     0
4 22-Oct-2019 18:04:00      0      0      0      0     0    0  0    0     0
5 22-Oct-2019 18:05:00      0      0      0      0     0    0  0    0     0
6 22-Oct-2019 18:06:00      0      0      0      0     0    0  0    0     0
  POS100 POS200 POS400 POS600 POS800
1      0      0      0      0      0
2      0      0      0      0      0
3      0      0      0      0      0
4      0      0      0      0      0
5      0      0      0      0      0
6      0      0      0      0      0
Our experiment data.frame is arranged as a tidy data.frame, with each row representing a single observation at a given treatment at a given time.
Here is what some of the experiment data look like:
          DateTimePDT Distance_m Experiment
1 2019-10-22 19:30:00          1   tidal-01
2 2019-10-22 19:30:00          1   tidal-01
3 2019-10-22 19:30:00          1   tidal-01
4 2019-10-22 22:05:00          1   tidal-01
5 2019-10-22 22:05:00          1   tidal-01
6 2019-10-22 22:05:00          1   tidal-01
So, the goal is for each row of our experimental data.frame, find the corresponding cell of the hydro data. Then, we need to repeat for 3 more files.
The options
There are several options for how to do this.
Perhaps the most straightforward: Convert the hydro data to a long or tidy format, identify “key” columns in both data sets, and then merge the two. This requires less thought on our part, because we will rely on
merge/jointo find the correct values and fill them in. A downside of this approach is it requires us to copy the data into a new data structure, which can be computationally and memory intensive, depending on how large each set is. In this case, the hydro data is 1799 x 15, so this is probably not a concern. Another downside is that we will need to create a new data.frame with the column for the merged data, verses being able to assign it to a vector which we can choose to assign into the data.frame or not. Sometimes we want to have the vector separate so we can test and check it, then assign it when we are ready.Requiring more thought: For each row of the experimental data.frame, find the corresponding row and column of the hydro data. Then subset out the correct value from the hydro data. At first glance, this probably seems extremely inefficient. You can imagine something like
ans = numeric(nrow(df))
for(n in seq(nrow(df))){
    r = which(hydro$Time == df$DateTimePDT[n])
    c = which(colnames(hydro) == df$Distance[n])
    ans[n] = hydro[r,c]
}
or to avoid the for loop,
sapply(seq(nrow(df)), function(i) {
    r = which(hydro$Time == df$DateTimePDT[i])
    c = which(colnames(hydro) == df$Distance[i])
    hydro[r,c]
})
Indeed, neither is particularly efficient. Thankfully, we can do this in a vectorized way.
I am going to use this second option, even though it seems less straightforward. This is because it is more flexible, which will become important later (spoilers).
Step 0: Link “treatments” between the data sets
You might have noticed in either of the above solutions, I skated over an important detail - the column names of our hydro data do not match our distances in the experiment data. Here are the column names in the hydro data:
 [1] "Time"   "NEG600" "NEG400" "NEG200" "NEG100" "NEG50"  "NEG1"   "LC"
 [9] "POS1"   "POS50"  "POS100" "POS200" "POS400" "POS600" "POS800"
and here are the distances in the experiment data.frame:
[1] 1 50 100 200 400 600 800 -600 -400 -200 -100 -50 -1
It seems that the hydro data uses “NEG” and “POS” rather than -.
So, before we do anything, we need to make these match. Thankfully,
this is mostly straightforward. We need to drop the “NEG” and replace
with -, and then drop the “POS” completely. We also need to figure
out what to do with the “LC” column.
Here we have another choice - we can modify the column names in place, or we can create a lookup table which shows which column of the hydro data corresponds to each distance in the experimental data.frame. Renaming the columns seems the most straightforward, but I am going to make a lookup table. Why?
For one, this gives me an intermediate output to check. Second, I said we could vectorize the subsetting. You might imagine something like,
mapply(function(r, c) {
    hydro[r,c]
},
r = match(df$DateTimePDT, hydro$Time),
c = match(df$Distance, colnames(hydro)))
However, this is still hammering away at [.data.frame by subsetting
a single value at a time. There is a way to do vectorized subsetting
by a vector of rows and a vector of columns. But we are getting ahead
of ourselves.
We need a function that will take our hydro data, and return the corresponding value in the experiment data. Here, we assume “LC” is actually the center point, i.e. distance = 0. First, we deal with the column names,
colnm_to_dist = function(x)
{
    x = gsub("POS", "", x)
    x = gsub("NEG", "-", x)
    x[x == "LC"] = 0
    x
}
Simple.
Actually… too simple. We hard-coded the relationship between
“POS/NEG” and the sign. These data sets came from two different
sources, and it is possible they had different interpretations of
which side was -. And maybe “LC” is not the 0 point. We would like
this to be more flexible.
colnm_to_dist = function(x,
                         subs = c(POS = "",
                                  NEG = "-",
                                  LC = "0"))
{
    nm = names(subs)
    for(i in seq_along(subs))
        x = gsub(nm[i], subs[i], x)
    x
}
OK, perhaps overkill in this case - it’s not clear changing the args is any more difficult than changing the function. But this does what we were hoping for.
Step 1: Rows and Columns
Now that we have this function, we can use it to get our column number in the hydro data for each row of the experiment data.
hydro_cols = colnm_to_dist(hydro)
cols = match(df$Distance_m, hydro_cols)
Next we need the rows,
rows = match(df$DateTimePDT, hydro$Time)
Step 2: Subsetting
So, we can use mapply to loop over these two, but that is not very
efficient. Thankfully, we can do vectorized subsetting by a 2-column
matrix, i.e. if we cbind our row and column values together, we can
use this to do efficient vectorized subsetting.
So, we can pull out the values we are interested in just by doing,
df[cbind(rows,cols)]
Step 3: Putting it all together
So, to put this all together into a single function,
get_hydro = function(df, hydro)
{
    hydro_cols = colnm_to_dist(colnames(hydro))
    cols = match(df$Distance_m, hydro_cols)
    rows = match(df$DateTimePDT, hydro$Time)
    as.numeric(hydro[cbind(rows,cols)])
}
Couple things of note - we need to convert the subset to numeric, but if you are not familiar with this method of subsetting, it might not be clear why. Subsetting by 2-column matrix is actually a method for matrices. This means that the hydro data.frame is being coerced to a matrix. Since it has the “time” column and a matrix needs to be of a single data type, the entire data.frame is converted to a character matrix. We can avoid this by dropping that column and only leaving the numeric columns, but then we need to compensate in our column index.
You also might have noticed that we have hard-coded some of the columns into our function. Again, any time we are hard-coding things, the function becomes less flexible.
So, there are some refinements that can be made.
Step 4: Refining
So, taking the above, we can modify the function,
get_hydro = function(df, hydro,
                     df_var = "Distance_m",
                     df_time = "DateTimePDT",
                     hydro_time = "Time")
{
    hydro_cols = colnm_to_dist(colnames(hydro))
    i = hydro_cols %in% unique(df[[df_var]])
    cols = match(df[[df_var]], hydro_cols[i])
    rows = match(df[[df_time]], hydro[[hydro_time]])
    hydro[,i][cbind(rows,cols)]
}
We are taking a few additional steps to find the “Time” column and then subset it out, but we should gain some speed by avoiding the coercion.
Step 5: Compare
Lastly, lets compare the speed of the different approaches. Below you will find all the functions, including a merge approach.
# merge approach
get_hydro_merge = function(df, hydro)
{
    hydro_cols = colnm_to_dist(colnames(hydro))
    t_cols = grep("Time", hydro_cols)
    hydro_long = data.frame(DateTimePDT = hydro[[t_cols]],
                            Value = unlist(hydro[-t_cols]),
                            Distance_m = rep(hydro_cols[-t_cols], each = nrow(hydro)))
    merge(df, hydro_long, all.x = TRUE, all.y = FALSE)$Value
}

# first attempt
get_hydro_orig = function(df, hydro)
{
    hydro_cols = colnm_to_dist(colnames(hydro))
    cols = match(df$Distance_m, hydro_cols)
    rows = match(df$DateTimePDT, hydro$Time)
    as.numeric(hydro[cbind(rows,cols)])
}

# for loop
get_hydro_for = function(df, hydro)
{
    hydro_cols = colnm_to_dist(colnames(hydro))
    ans = numeric(nrow(df))
    for(n in seq(nrow(df))){
        r = which(hydro$Time == df$DateTimePDT[n])
        c = which(hydro_cols == df$Distance_m[n])
        ans[n] = hydro[r,c]
    }
    ans
}

# sapply
get_hydro_sapply = function(df, hydro)
{
    hydro_cols = colnm_to_dist(colnames(hydro))
    sapply(seq(nrow(df)), function(i) {
        r = which(hydro$Time == df$DateTimePDT[i])
        c = which(hydro_cols == df$Distance_m[i])
        hydro[r,c]
    })
}

# mapply
get_hydro_mapply = function(df, hydro)
{
    hydro_cols = colnm_to_dist(colnames(hydro))

    mapply(function(r, c) {
        hydro[r,c]
    },
    r = match(df$DateTimePDT, hydro$Time),
    c = match(df$Distance_m, hydro_cols))

}

# final version
get_hydro_optimized = function(df, hydro,
                     df_var = "Distance_m",
                     df_time = "DateTimePDT",
                     hydro_time = "Time")
{
    hydro_cols = colnm_to_dist(colnames(hydro))
    i = hydro_cols %in% unique(df[[df_var]])
    cols = match(df[[df_var]], hydro_cols[i])
    rows = match(df[[df_time]], hydro[[hydro_time]])
    hydro[,i][cbind(rows,cols)]
}

funs = list(get_hydro_merge, get_hydro_orig, get_hydro_for,
            get_hydro_sapply, get_hydro_mapply, get_hydro_optimized)

res = lapply(funs, function(fn){
    t(replicate(100, system.time(fn(tidal01, hydro))))
})
ans = structure(sapply(res, function(x) median(x[,1])),
          names = c("merge", "original", "for-loop",
                    "sapply", "mapply", "avoid-coerce"))
sort(ans, decreasing = TRUE)
    for-loop       sapply        merge       mapply     original avoid-coerce
      0.3295       0.3200       0.1000       0.0670       0.0350       0.0060
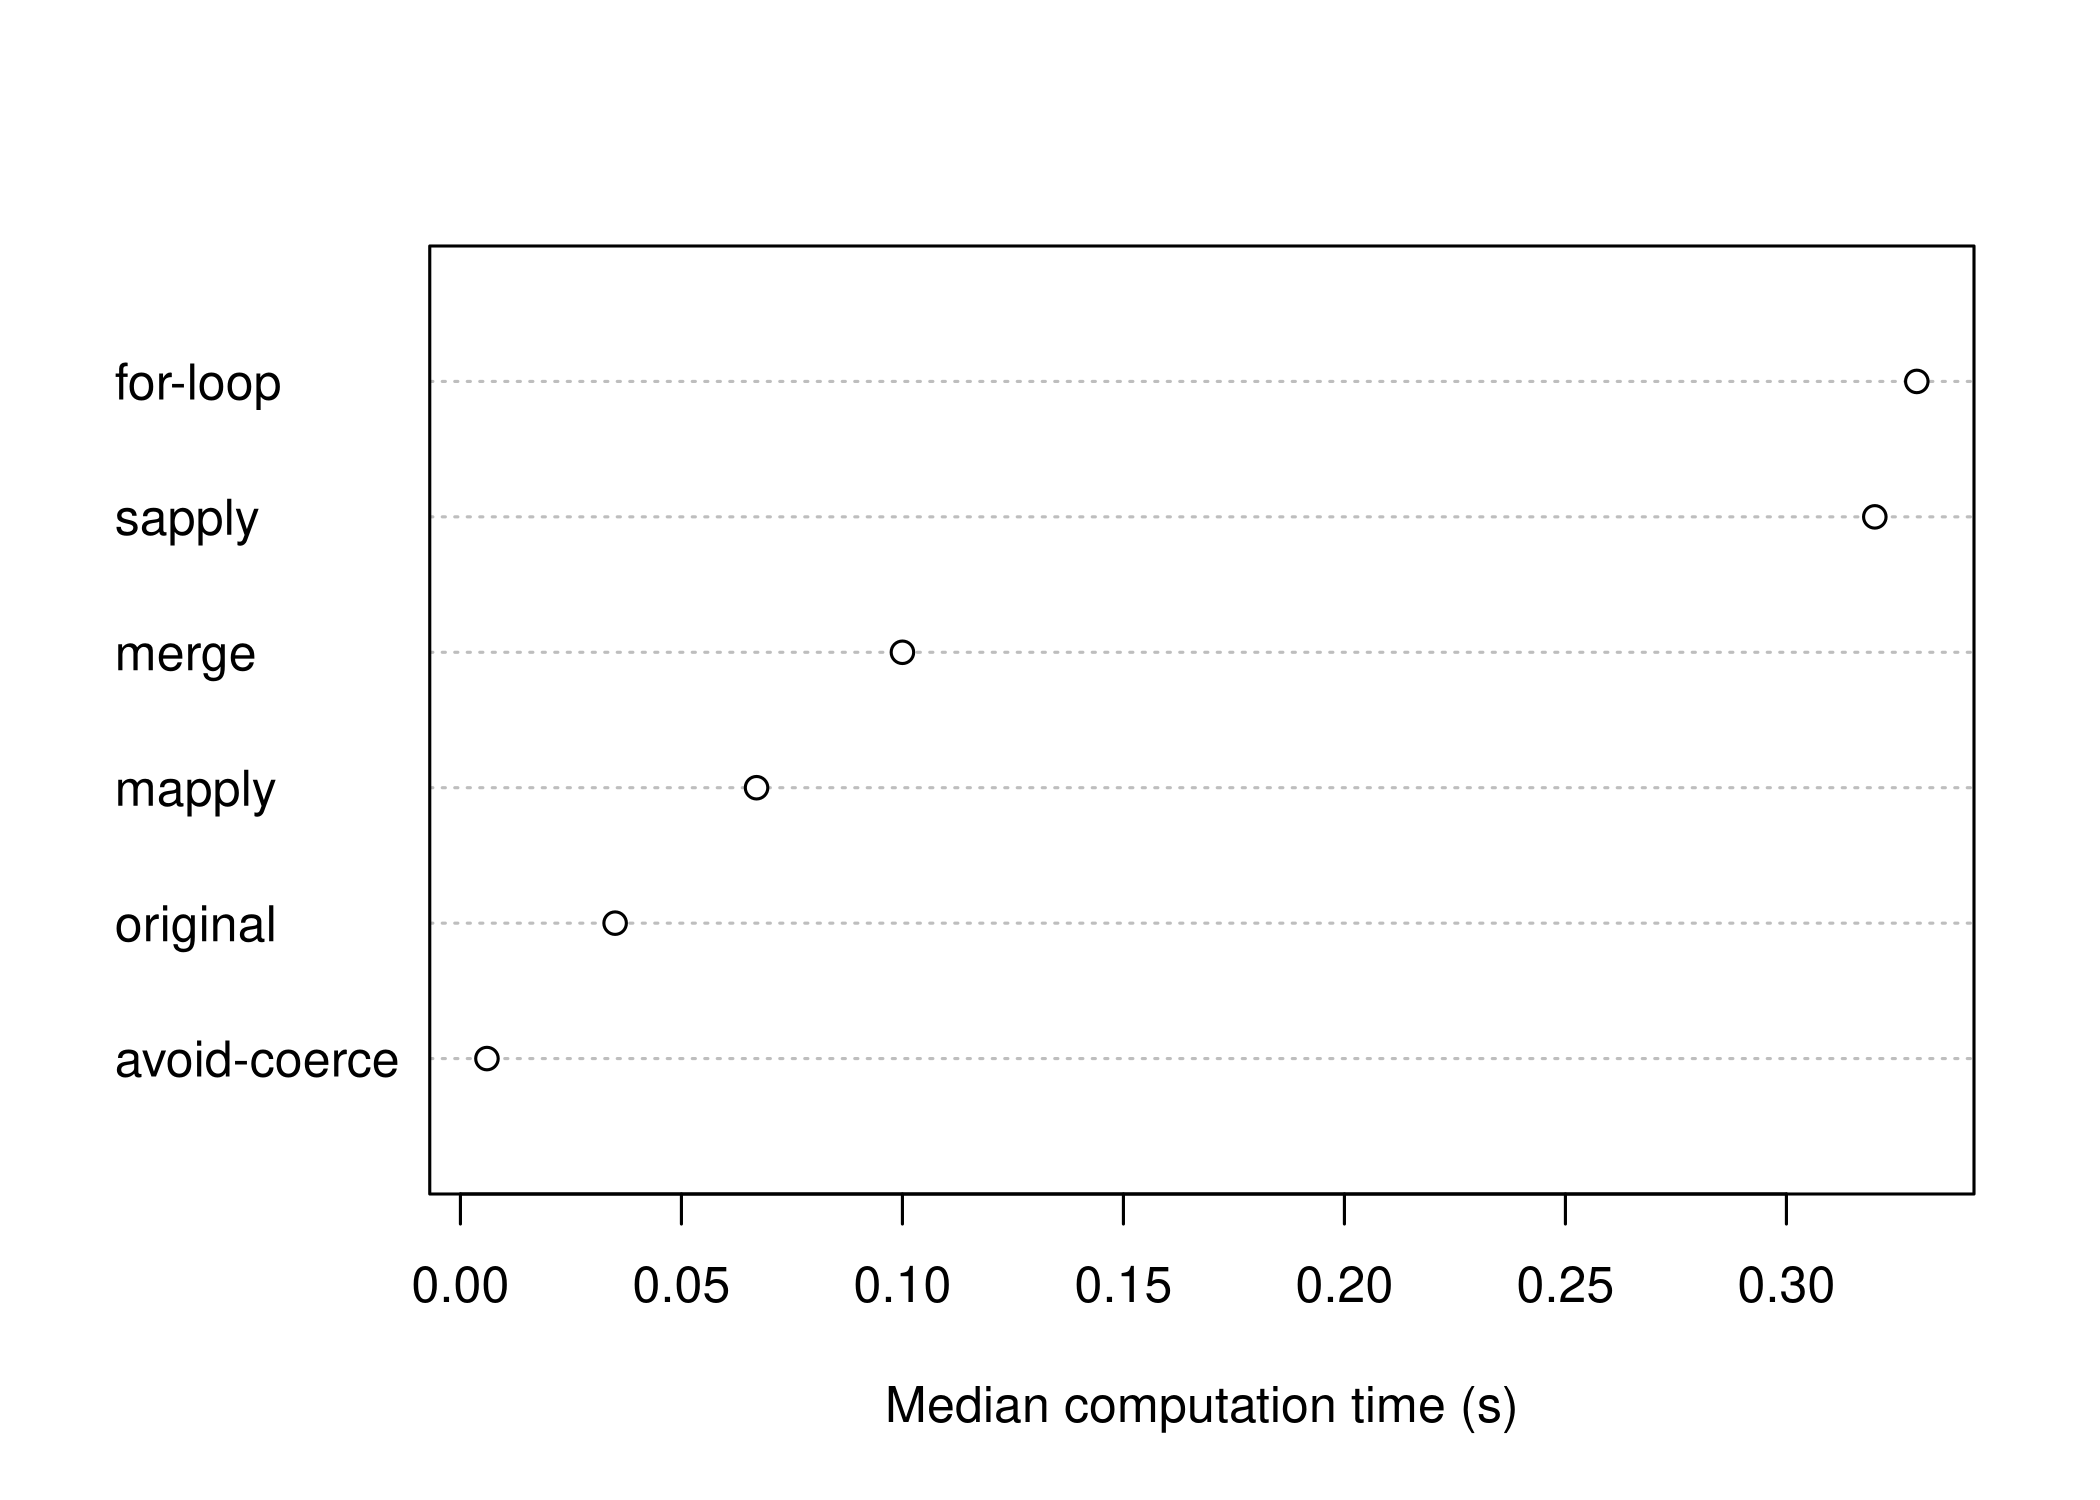
Unsurprisingly, the
for-loop is the slowest. This makes sense - it is not vectorized at all. But it also did not require much thought from us - it is the easiest conceptually. Depending on our experience with R, it might be the lowest effort in terms of development time.The
sapplyversion is only slightly faster than theforloop. Since ourforloop is pre-allocating the results vector, we are probably not gaining much fromsapply, while also increasing our overhead.Next is the
mergeversion - we get a 3x speedup vs. theforloop. This result actually not terrible. We get reasonable speed without having to think about the computations sincemergeis handling linking up the observations for us.Next is the
mapplyversion. Even though it is “vectorized”,mapplyadds a lot of overhead, and the base computation is still not vectorized. Compared to code that is natively vectorized, this is slow.In second place and an order of magnitude faster than the
forloop is our first attempt.Almost an order of magnitude faster than our original and over 50x faster than the
forloop is the version that avoids the double coercion.
So, what’s the point?
Writing functions requires some iteration. The first version is rarely the best, and it requires some experimentation to get right.
Making a function flexible requires avoiding hard-coding variables, and allowing default values to be adjusted by the end user. While we did not explore the advantages of this, I will show later how valuable it can be.
Understanding how R is handling certain data structures can allow you to understand what computational methods tend to be more efficient.
Getting efficient R code requires seeking means to get natively vectorized code, and avoid implicit operations.